
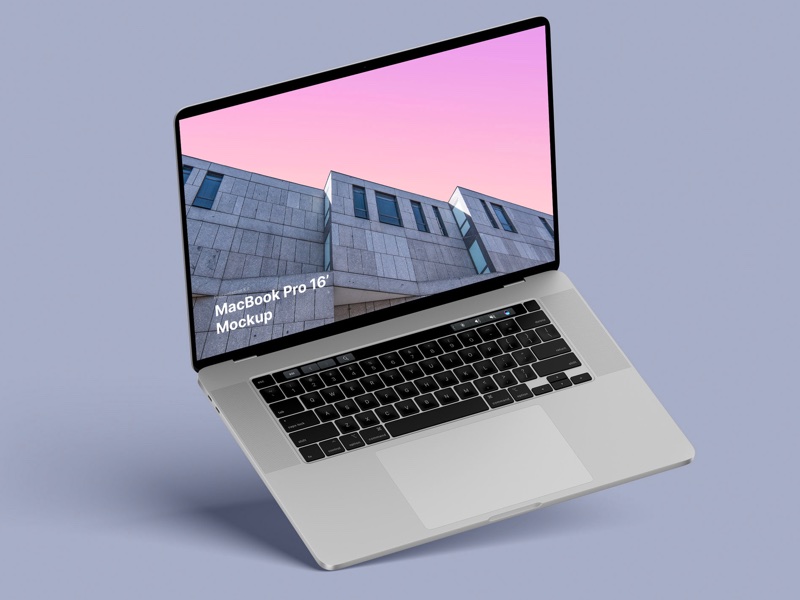
MacBook Pro 16” Mockups 🔥
– in 4 materials (clay versions included)
– 12 scenes
– 48 MacBook Pro 16″ mockups
– 6000 x 4500 px
Design resources, Photoshop add-ons, UI Kits and Inspiration
– in 4 materials (clay versions included)
– 12 scenes
– 48 MacBook Pro 16″ mockups
– 6000 x 4500 px
I have a scanner without multiscanning, so I have to do it manually. The problem is how do I eliminate extreme values when averaging?
Let’s say 4 scans result in following values for a point: 123, 125, 127 and 250. Obviously, 250 is a fluke and this spike should be eliminated before averaging out the first three values.
Question: How do I do this in Photoshop 6? Layering the 4 images with opacity of 50%, 33% & 25% would include the extreme value.
[…]
Layering requires perfect registration of the individual images, so spend some time on getting that right. You could also consider using a program like Registax (http://aberrator.astronomy.net/registax/) to do the work for you.
I should think he wouldn’t be moving the negatives between scans, so he could use Photoshop’s simple shift-drag to align the images from each image as a new layer into one image perfectly.
I have a scanner without multiscanning, so I have to do it manually. The problem is how do I eliminate extreme values when averaging?
Let’s say 4 scans result in following values for a point: 123, 125, 127 and 250. Obviously, 250 is a fluke and this spike should be eliminated before averaging out the first three values.
Statistically, 250 could be correct and the other three could be wrong…;-) I’d just use them as they are.
Question: How do I do this in Photoshop 6? Layering the 4 images with opacity of 50%, 33% & 25% would include the extreme value.
Perhaps you can give a little less weight to the one you mistrust.
Layering requires perfect registration of the individual images, so spend some time on getting that right. You could also consider using a program like Registax (http://aberrator.astronomy.net/registax/) to do the work for you.
I should think he wouldn’t be moving the negatives between scans, so he could use Photoshop’s simple shift-drag to align the images from each image as a new layer into one image perfectly.
Regarding merging, besides the layer modes he can use apply-image which gives proper registration and the subtract, add, mask and more options.
Most scanners (linear array CCD) have a little play in their (re)positioning mechanism, so perfect registration is not likely. Also the film may heat-up and change shape. Half pixel offsets will blur the composite.
I have a scanner without multiscanning, so I have to do it manually. The problem is how do I eliminate extreme values when averaging?
Let’s say 4 scans result in following values for a point: 123, 125, 127 and 250. Obviously, 250 is a fluke and this spike should be eliminated before averaging out the first three values.
Question: How do I do this in Photoshop 6? Layering the 4 images with opacity of 50%, 33% & 25% would include the extreme value.
Thanks!
Don.
Question: How do I do this in Photoshop 6? Layering the 4 images with opacity of 50%, 33% & 25% would include the extreme value.
Perhaps you can give a little less weight to the one you mistrust.
The problem is that you will not have one particular scan you mistrust. If that was the case, you simply could not include that scan at all. However, in scan A, pixel A may be the one that is too bright, but in scan B it may be pixel B. That’s the whole idea behind multiple scanning. I think there is no way to do what you want. You’ll just have to live with the idea that the extreme values will be included, but at least they will be averaged out.
I have a scanner without multiscanning, so I have to do it manually. The problem is how do I eliminate extreme values when averaging?If you have a Nikon scanner, you will find that the scan consistency is excellent. I used to do multiple scans and then layer them in Photoshop. I would use opacities as well as the Photoshop layer options to ‘tune in the areas that I wanted. I have Photoshop actions that will do this for 16 layers. I used it to get cleaner shadow detail.
Let’s say 4 scans result in following values for a point: 123, 125, 127 and 250. Obviously, 250 is a fluke and this spike should be eliminated before averaging out the first three values.
Question: How do I do this in Photoshop 6? Layering the 4 images with opacity of 50%, 33% & 25% would include the extreme value.
The thing is that if you have a Nikon Ls40, there is very little to be gained in multiscanning.
I now have a Ls50, having sold my Ls40. It is terrific. It still has a problem with really dark Kodachromes, but in every other respect, it gets pretty much all the can be got from a image.
I’m not a statistician, but it’s quite common (if not required) in statistics to exclude extreme values before averaging out.
You put your finger on it! It’s exactly those dark Kodakchromes which are responsible for lumps of hair on the floor and scratch marks on the walls… ;o)
On Tue, 24 Feb 2004 15:25:47 +0100, "Bart van der Wolf" wrote:
I have a scanner without multiscanning, so I have to do it manually. The problem is how do I eliminate extreme values when averaging?
Let’s say 4 scans result in following values for a point: 123, 125, 127 and 250. Obviously, 250 is a fluke and this spike should be eliminated before averaging out the first three values.
Statistically, 250 could be correct and the other three could be wrong…;-) I’d just use them as they are.
Actually, statistically, 250 is way out, but it may be right *realistically*! ;o)
Question: How do I do this in Photoshop 6? Layering the 4 images with opacity of 50%, 33% & 25% would include the extreme value.
Perhaps you can give a little less weight to the one you mistrust.
That’s the problem, I can’t examine every pixel manually.
Statisticians often remove high values and low values before averaging out exactly to avoid accidental samples. They also use other rude words such as "standard deviation" and so on… 😉
Of course, given enough samples even a simple averaging would "tame" those extreme values, but a more intelligent approach may eliminate the need for superfluous scanning which both, saves time and is easier on the scanner.
Layering requires perfect registration of the individual images, so spend some time on getting that right. You could also consider using a program like Registax (http://aberrator.astronomy.net/registax/) to do the work for you.
I’ll have a look, although I really prefer to do it myself, if for no other reason than as a learning exercise.
If you have a data set with a large number of "outliers", you could use the median value instead of the mean ("average") value. That is, sorting the data in the set from low-to-high, and picking the middle one.
E.g. 126, 127, 5, 189, 128, 176, 46
Sort: 5, 46, 126, 127, 128, 176, 189
Median: 127
Mean: 113.9
Another refined method would be to use a trimmed mean. In this case you also sort the dataset, discard a number/percentage of the top and bottom values, and calculate the mean of the intermediate values.
E.g. the interquartile mean:
http://en.wikipedia.org/wiki/Interquartile_mean
Problem with all these methods based on a median is that you need to sort the values in the dataset. This is a pretty slow operation. Especially to do this pixel for pixel, combining data from multiple image files.
And the result would probably only be a marginal improvement. But if you have spare time to write some code…
"Don" wrote in message
You put your finger on it! It’s exactly those dark Kodakchromes which are responsible for lumps of hair on the floor and scratch marks on the walls… ;o)
D-M-A-X is the clue here. Perhaps one day we won’t have to use dumbed-down film to suit scanners.
On Wed, 25 Feb 2004 11:50:55 -0600, "jjs" wrote:
D-M-A-X is the clue here. Perhaps one day we won’t have to use dumbed-down film to suit scanners.
Not to mention, 20+ years ago when my Kodachromes were taken – who knew?
Still, I blame Nikon for not retrofitting this on older scanners and refusing to help in any way. But that’s another story…
…
Problem with all these methods based on a median is that you need to sort the values in the dataset. This is a pretty slow operation. Especially to do this pixel for pixel, combining data from multiple image files.
And the result would probably only be a marginal improvement. But if you have spare time to write some code…
I will definitely do this for fun, but you’re right about marginal improvement and the time aspect. After all I was trying to do this in Photoshop exactly to save time by having to do fewer scans.
Actually, you can compute the median or any other order statistic in linear time without sorting.
And the result would probably only be a marginal improvement. But if you have spare time to write some code…
I will definitely do this for fun, but you’re right about marginal improvement and the time aspect. After all I was trying to do this in Photoshop exactly to save time by having to do fewer scans.
Good luck with the coding. If it works, and it’s a useful tool for averaging image files, will you share it with us? 🙂
In article ,
OLM writes:
…
Problem with all these methods based on a median is that you need to sort the values in the dataset. This is a pretty slow operation. Especially to do this pixel for pixel, combining data from multiple image files.
Actually, you can compute the median or any other order statistic in linear time without sorting. Computing a median is a little slower than computing a mean, but the difference is hardly enough to be a major obstacle.
In article <c1lmll$n6f$ (Warren
Sarle) wrote:
Actually, you can compute the median or any other order statistic in linear time without sorting.
You have a privileged view of statistics, Warren. 🙂 What you wrote is quite true. Perhaps we should be putting such routines into a freeware/shareware collection. (Can you do that as an employee of SAS? I truly do not know.)
On 26 Feb 2004 20:58:29 GMT, (Warren Sarle) wrote:
…
Actually, you can compute the median or any other order statistic in linear time without sorting. Computing a median is a little slower than computing a mean, but the difference is hardly enough to be a major obstacle.
So, what’s the consensus regarding whether Photoshop (version 6 here) can do this out of the box?
As I wrote, simple layering (with opacities at 50%, 33%, 25%, etc) just calculates the mean without eliminating high and low values.
Is there a way to do this "properly" in PS 6 using "trimmed mean"? (Thanks for the clear explanation OLM!)
I’m pretty sure that Photoshop 7 cannot do medians. I don’t even see any way to do medians in the Reindeergraphics plug-ins.
You can compute min and max using the Darken and Lighten blending modes, so you might be able to write an action or script that does a trimmed mean by computing the arithmetic mean (as you indicated with the 50%, 33%, etc., trick) and then subtracting a multiple of the min and the max, and then renormalizing.
On Tue, 24 Feb 2004 23:10:45 +0000 (UTC), Mike Engles
wrote:
I have a scanner without multiscanning, so I have to do it manually. The problem is how do I eliminate extreme values when averaging?If you have a Nikon scanner, you will find that the scan consistency is excellent. I used to do multiple scans and then layer them in Photoshop. I would use opacities as well as the Photoshop layer options to ‘tune in the areas that I wanted. I have Photoshop actions that will do this for 16 layers. I used it to get cleaner shadow detail.
Let’s say 4 scans result in following values for a point: 123, 125, 127 and 250. Obviously, 250 is a fluke and this spike should be eliminated before averaging out the first three values.
Question: How do I do this in Photoshop 6? Layering the 4 images with opacity of 50%, 33% & 25% would include the extreme value.
Yes I do have a Nikon scanner, but it’s an LS-30… 🙁
The thing is that if you have a Nikon Ls40, there is very little to be gained in multiscanning.
I now have a Ls50, having sold my Ls40. It is terrific. It still has a problem with really dark Kodachromes, but in every other respect, it gets pretty much all the can be got from a image.
You put your finger on it! It’s exactly those dark Kodakchromes which are responsible for lumps of hair on the floor and scratch marks on the walls… ;o)
I’ve been wrestling with this for months and not giving up yet. No choice really, since I can’t afford a new scanner at this time.
Don.
– in 4 materials (clay versions included)
– 12 scenes
– 48 MacBook Pro 16″ mockups
– 6000 x 4500 px
Nice and short text about related topics in discussion sections


